
Key performance indicators
Measuring our progress, both financially and operationally
Financial
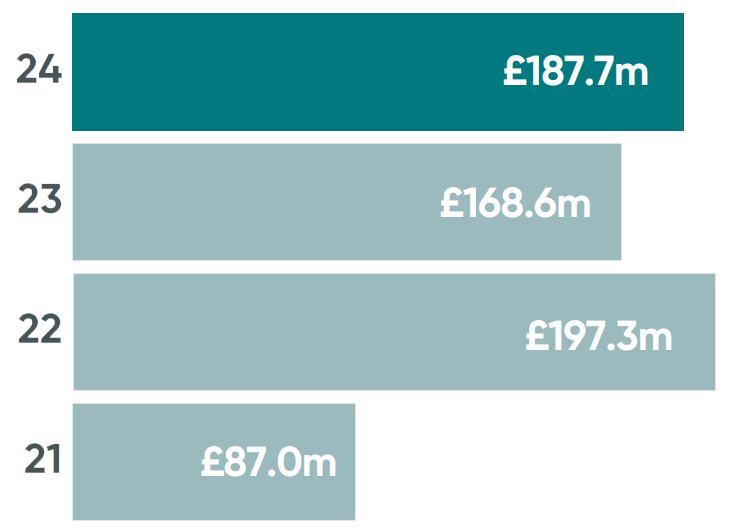
Adjusted Operating Profit (£m)
2023: £168.6m
Relevance to strategy
A key measure of the overall performance of the business.
We are focused on driving growth in operating profit in order to generate higher and sustainable returns for our shareholders and providing the platform for further growth for all our stakeholders including our employees, our customers and our partners.
Performance
Adjusted Operating Profit increased to £187.7m (FY23: £168.6m) boosted by strong passenger growth and in-year benefits from operational efficiencies and Accelerate cost reduction programme, despite a reduction in Covid-19 funding.
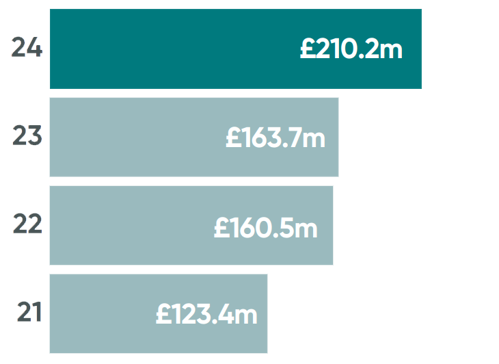
Free cash flow (£m)
2023: £163.7m
Relevance to strategy
Strong cash generation provides the funding to invest in initiatives to drive our strategy.
Our focus on cash generation ensures that we are running the business efficiently, converting profit to cash to enable investment into the business; reduction in leverage returns to shareholders; and providing the platform for further growth for all our stakeholders.
Performance
Free cash inflow of £210.2m represents strong Free Cash Flow conversion of 112% (FY23: 97%). The improvement in Cash Flow Conversion is a result of good working capital management in particular increased cash collections in the year, and improved Adjusted EBITDA from performance upside.
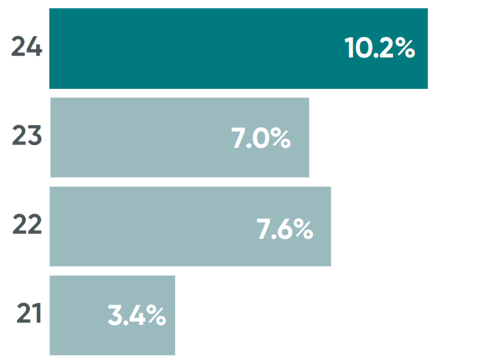
Return on capital employed (%)
2023: 7.0%
Relevance to strategy
ROCE demonstrates how efficiently the Group is deploying its capital resources to generate operating profit.
A focus on ROCE ensures that we maintain a disciplined approach to capital investment and continue to invest in those areas in which we deliver the best returns. This ensures that we maximise returns to shareholders for the capital they invest.
Performance
ROCE of 10.2% remains below our targeted level of 12.5% and is reflective of the yearon-year reduction in Net Assets. During the year the Group invested £157 million of net maintenance capital, predominantly in replacing our fleet in our existing operations, and £59m in growth capital expenditure including vehicles to service new contracts in ALSA and North America.
Non-financial
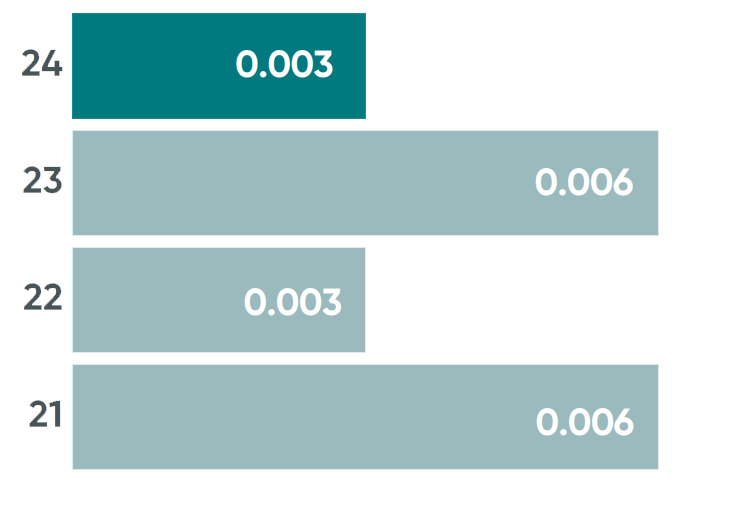
Safety - Fatalities and Weighted Injuries
2023: 0.006
Relevance to strategy
Safety is of paramount importance to a public transport operator and being the ‘safest’ is one of the five Evolve outcomes.
Safety is at the heart of our values and is our priority for both our customers and our employees.
High safety standards also help to drive sustainable growth through customer loyalty and new business wins.
Performance
The Group FWI index target for 2024 was met and was the second best result on record, which demonstrates the relentless focus on safety. However, there was one preventable fatality during the year, and therefore although the Group target was achieved, there is no bonus pay out on the FWI metric in 2024 for Executive Directors as a result of the fatality.
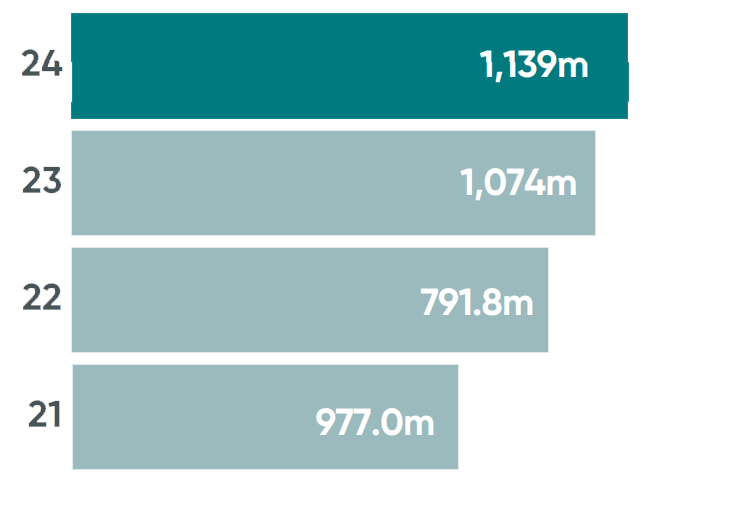
Passenger journeys
2023: 1,074m
Relevance to Strategy
Growth in passenger journeys is a leading indicator for customer satisfaction and hence growth, and modal shift from cars to public transport. Having the ‘most satisfied customers’ is a key aim of the Evolve strategy.
Mobico is targeting increased passenger ridership as a longer-term driver of sustainable value for both the business and the environment, with public transport a key solution to lowering carbon emissions and easing travel congestion.
Performance
Passenger journeys have continued to grow, rising 6% in 2024. UK Coach faced a challenging year with patronage declining 11% which was more than offset with an increase in ALSA long-haul business of 11% and UK Bus increase of 9%. Our Moroccan business continues to grow steadily with further passenger growth of 1%.
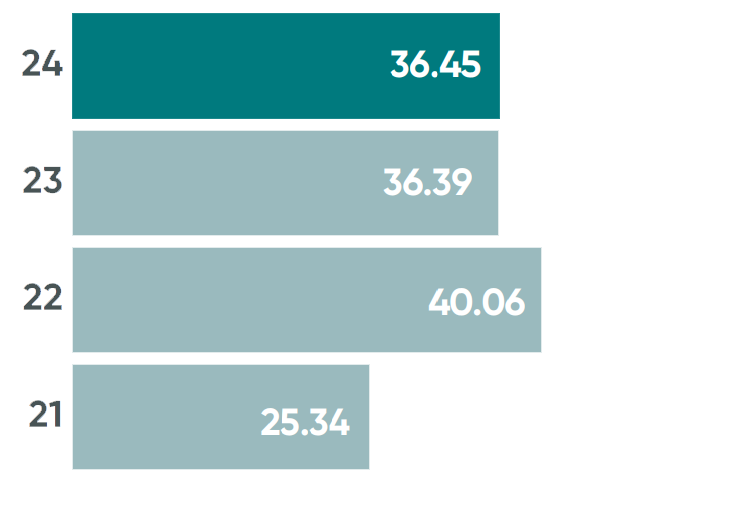
GHG emmissions
2023: 36.39
Relevance to Strategy
Reducing the environmental impact of transport is core to our purpose and links to the Evolve strategy outcome: being the environmental leader. Per passenger, train, bus and coach travel is significantly less polluting than cars and, as such, modal shift is the single most important thing we can do to drive the climate change and clean air agendas. We are also committed to making public transport itself greener and have adopted Science-Based targets.
Performance
Tonnes of carbon emissions for Scope 1 and 2 reduced by 3.6% per million passenger kilometer. Total Scope 1, 2 and 3 absolute emissions increased by 1.9% overall on prior year, the majority of which is allocated to Scope 3 Category 2, Capital Goods, from an increase in new vehicles on balance sheet during the year. We expect to make further progress as we accelerate our transition to ZEVs in the near future; UK Bus has demonstrated a further 11% decrease in Scope 1 & 2 emissions with 133 new EVs in service this year.
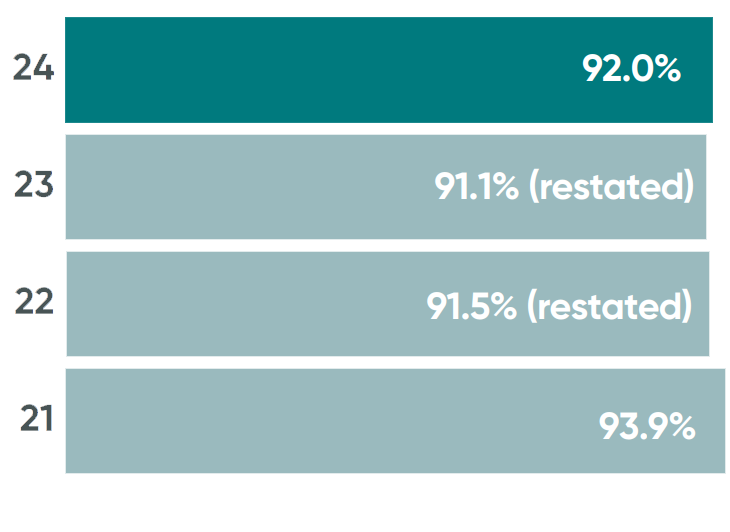
On-time Performance
2023: 91.1% (restated)
Relevance to strategy
Improving OTP is a key driver for customer retention and winning new contracts, and links to the Evolve strategy outcome: most reliable. Our reputation for reliability, whether it be for fare paying passengers on our buses, or with school boards and local passenger transport authorities, is vital to drive growth across each of our businesses. OTP is also a driver for achieving operating efficiencies across the Group, helping to improve financial returns.
OTP is also a driver for achieving operating efficiencies across the Group, helping to improve financial returns.
Performance
The Group’s On-Time-Performance significantly improved in 2024. Overall OTP was buoyed by a strong improvement in punctuality across several of our divisions, including in the UK and North America, and consistent top performance in our ALSA business. We introduced initiatives in UK Bus which yielded improvements in our punctuality and reliability, and were supported by our focus on driver recruitment and retention alongside our use of Artificial-Intelligence enabled scheduling tools. Performance in our North American Transit business also improved following the amalgamation of this business into our WeDriveU business, enabling greater oversight and focus. In our North America School Bus business, we have delivered our second consecutive year of a year-on-year improvement in punctuality as a result of our relentless focus on driver recruitment and retention, route restoration and optimisation, and ensuring operational excellence. Our ALSA business continues to deliver top performance, with the business benefiting from the introduction of our sophisticated digital scheduling platform.
Creating long-term value
Our Belief: quality mass transit is fundamental to a safe, green and prosperous future
Financial overview
Group Income Statement, Group Balance Sheet, Group Cash Flow Statement, Five Year Summary.